
XL-A Lamp Diagnostics
It is important to have a well functioning instrument for acquisition of AUC data. Often overlooked are some important diagnostics relating to the lamp and the monochromator of the XL-A. Several issues need to be reviewed to make sure that the lamp is functioning properly. First, the intensity of the lamp should be checked. Both the UV and the visible intensity should be appropriate. This can be accomplished by scanning the wavelength intensity of the lamp in air. Simply an empty hole at 3000 rpm. The highest peak should be at the emission maximum of a Xenon lamp at 230 nm, and measure between 20,000-40,000 counts. If the intensity is less than 15,000, the lamp should be cleaned. If the intensity even after cleaning is lower than 15,000 counts, the lamp may need to be aligned. Rotate the lamp in the lamp housing by a few degrees and repeat the intensity scan. Repeat for one full turn, identifying the position that produces the highest intensity. Verify that this is reproducible across all positions in the cell. For the test, a start value of 6.5 cm should suffice.
If the monochromator is working correctly, the peak should not be shifted to a different wavelength, and it should not be too small in comparison with other peaks. A correctly emitting lamp profile can be seen here.
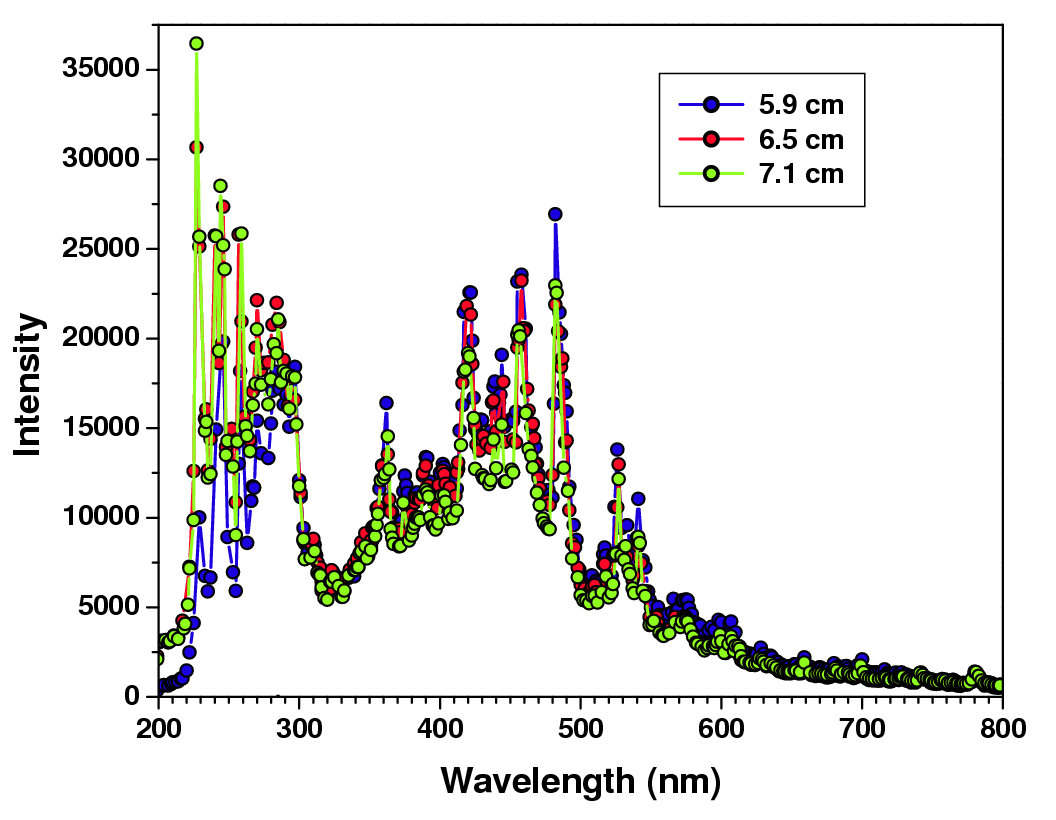
The following diagnostics is quite informative: Perform a wavelength intensity scan from 200-700 nm using 1 nm increments and no averages in continuous mode, at 5.9 cm radial setting. Repeat this scan 3 times. The scans should be well reproducible. Now repeat the 3 scans, except at 6.5 cm setting, and also at 7.1 cm. ALL 9 scans should be completely congruent. Here is an example for a case where the scans are not congruent.
If all scans overlay, the monochromator generates reproducible wavelengths, and the intensity is the same in each position. Intensity fluctuation should not be more than approximately 10% across the cell at any wavelength or position.
Optical system Flaws: Here is an example for an optical system that shows markedly different intensities in the UV range. Another issue here is the variation in the position of most peaks. They should not shift around as much, which is a sign of a faulty monochromator. Exchange the monochromator to see if the problem is related to it. The variation in intensity can be caused by dirt in the optical path, most often it is oil from the diffusion pump that has accumulated on the various optical components and now obliterates the path, most notably in the UV. Another issue may be lack of proper alignment of the lamp. Rotate the lamp by a few degrees inside its housing to find the "sweet spot" where intensity is most consistent and highest for all wavelengths and positions in the cell. This takes some experimentation to determine.
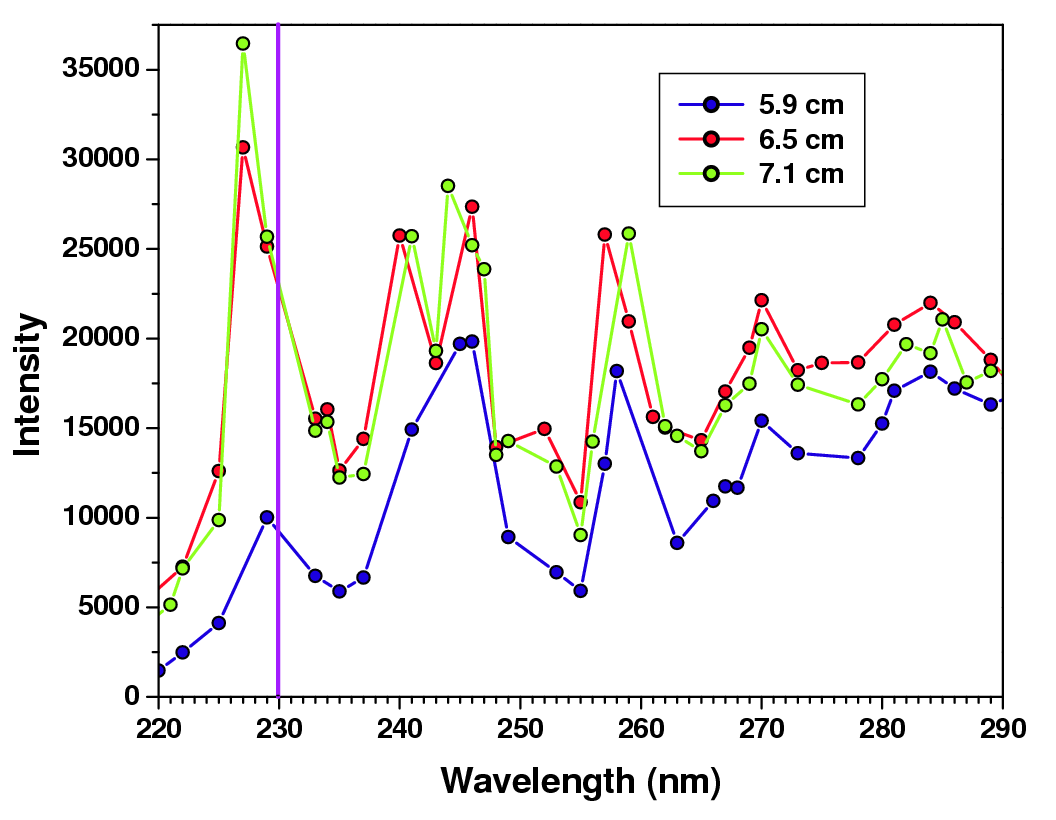
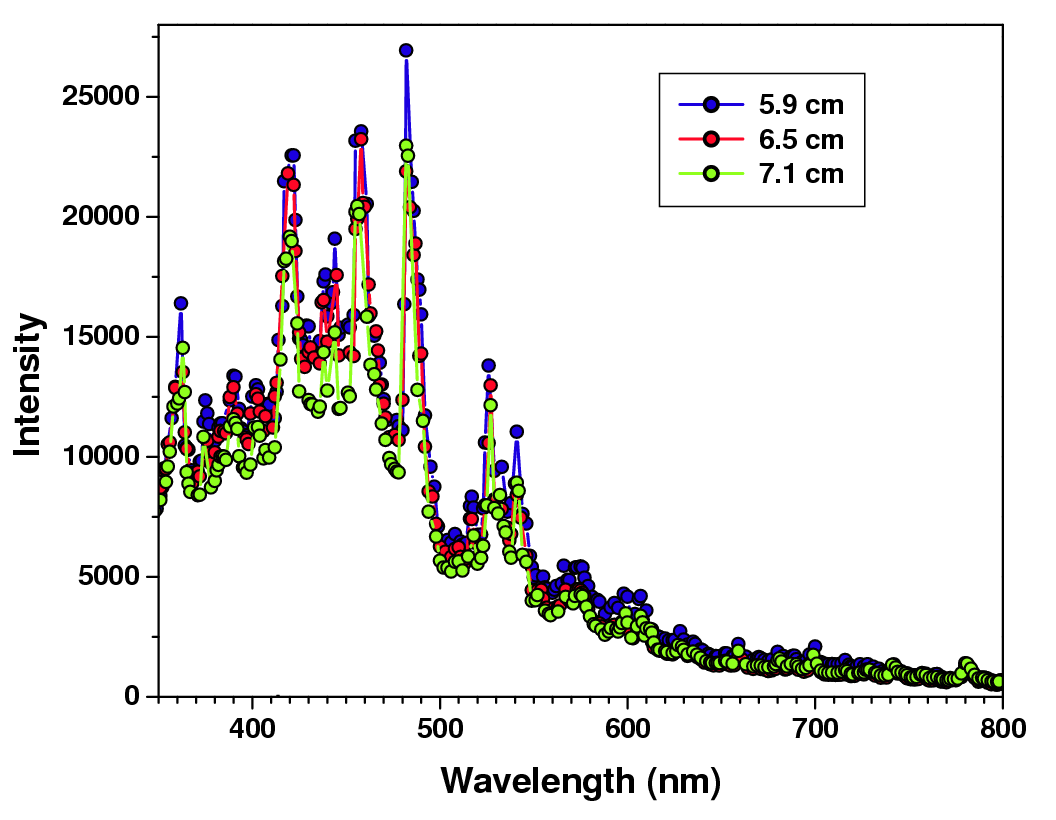
The intensity variation effect may be less in the visible range. In fact, in this particular example the 5.9 position provides higher intensity in the visible, but much lower intensity in the UV. Another issue with this data is the clear discrepancy of the 230 peak. Not only do the intensities vary greatly for different radial positions, but also, the position of the 230 peak varies between radial positions, and has "moved" to 227 nm. Clearly, the wavelength calibration is off, and there is some monochromator flaw that allows the wavelength to shift between scans. This is not desirable, especially in the 230 nm range since it falls on the shoulder of an absorbance peak.