Time State Viewer
The Time State viewer module provides users with the metadata of only select dataset. Metadata include the RunID, filename, directory location and Instrument parameters (TimeInterval, Time, RawSpeed, SetSpeed, ω²T, Temperature and step) across the experimental time/scan number.
Process
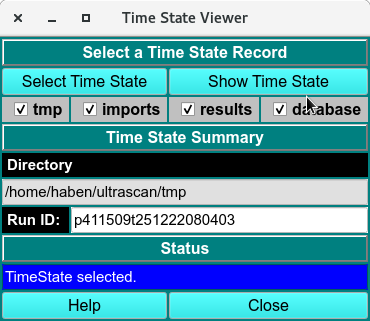
Step 1. Click Select Time State to select a run.
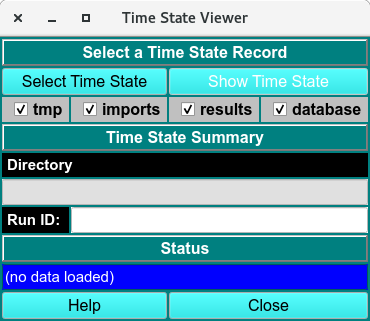
Step 2. Show Time State button is enabled and call the Time State Plots window.
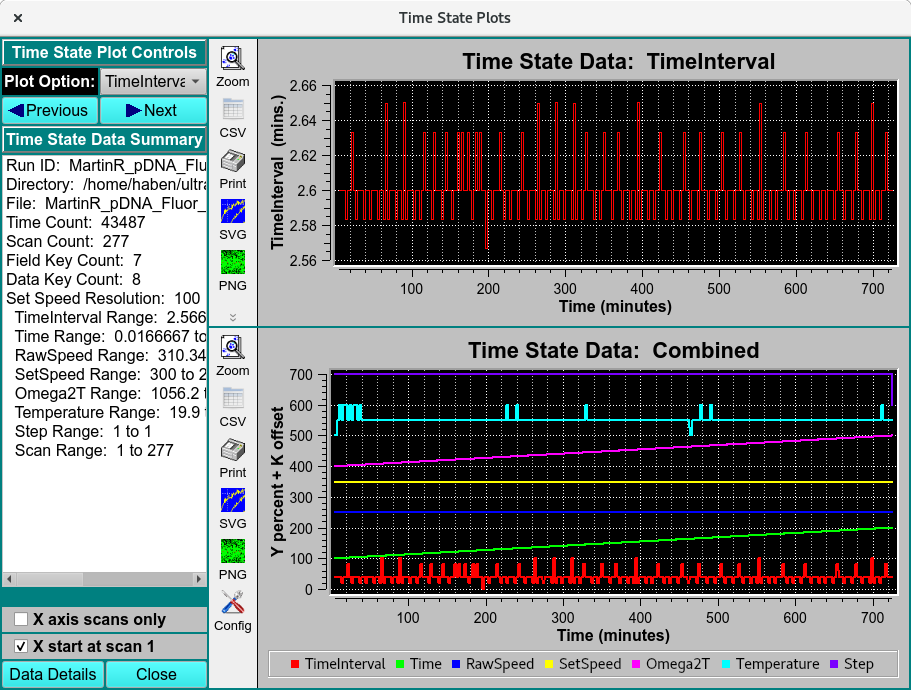
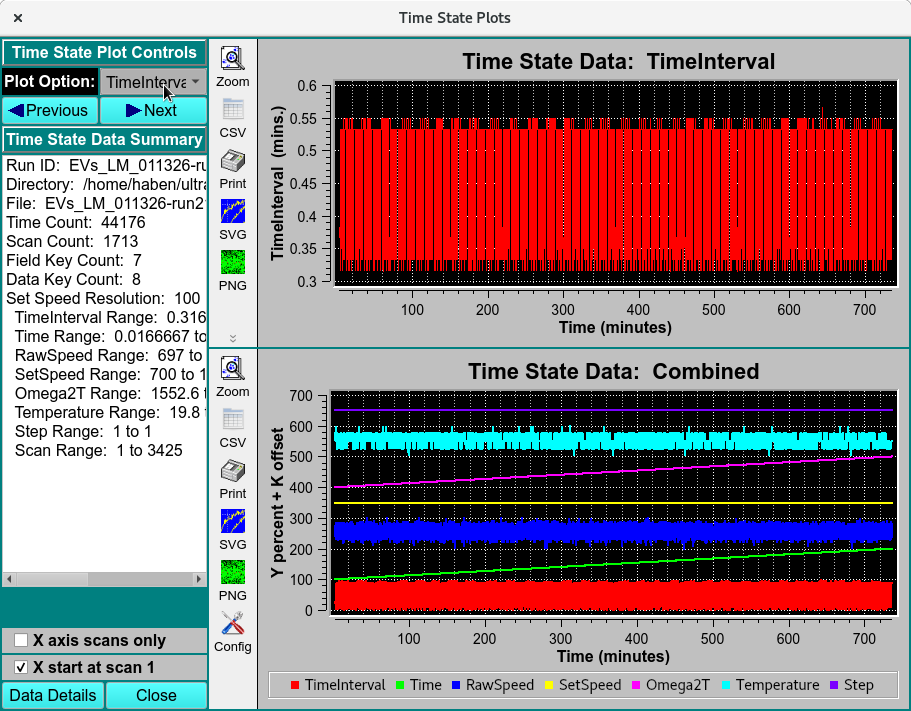
Step 3. Flip through the pulldown Plot Options(TimeInterval, Time, RawSpeed, SetSpeed, ω²T, Temperature and step) to plot in the individual time state data. The bottom Time State data: Combined show the combined curves of TimeInterval, Time, RawSpeed, SetSpeed, ω²T, Temperature and step across the total scan number.
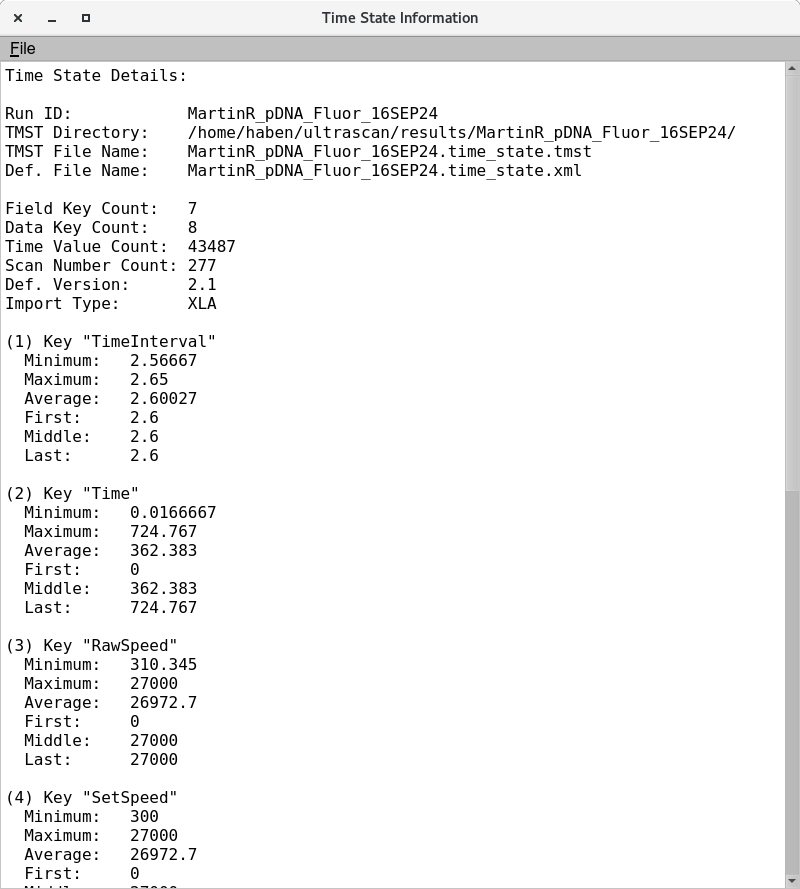
Step 4. Click Data Details to load the Time State Details: of the run.