Multi-Wavelength Raw Data Viewer
This module presents options for viewing multi-wavelength data for purposes of quality control. The user may, in this way, identify any problems in the experiment and get a sense of the wavelength, radial, and intensity ranges represented. Two types of input may be loaded for viewing.
Raw MWL: The unprocessed .mwrs files of a run.
US3 MWL: The already imported US3 .auc files for an experiment.
Process:
Load MWL Data: Load multi-wavelength data to view by clicking on Load Raw MWL Data or Load US3 MWL Data, depending on the available or desired data type.
Define 2-D Plot and Ranges: Set radius and lambda ranges; determine averaging count; choose the X-axis (radius or lambda); and possibly use the plot window Config option to refine the resulting 2-dimensional plot.
Show a 2-D Movie: Once a 2-D plot and its ranges have been established, show a 2-D movie of all lambda/radius records to view the progression of data through record ranges.
Show and Refine 3-D Plot: Click on Plot 3D to bring up a control window. Within that dialog, choose scales and bring up a 3-D plot window. Continue to refine scales and orientation until the 3-D plot is as desired.
Show a 3-D Movie: Once a 3-D plot, with its scales and orientation, has been established, show a 3-D movie to see the change in data over time (scans). Note that scans may be excluded and a range of scans chosen to refine this movie.
Save Plots and Movies: When plots and movies are all in a desired and informative state, you may save the plots and save frame files from the movies for processing by external imaging software.
The main MWLR_Viewer window is shown here in the state it appears after loading US3 MWL data.
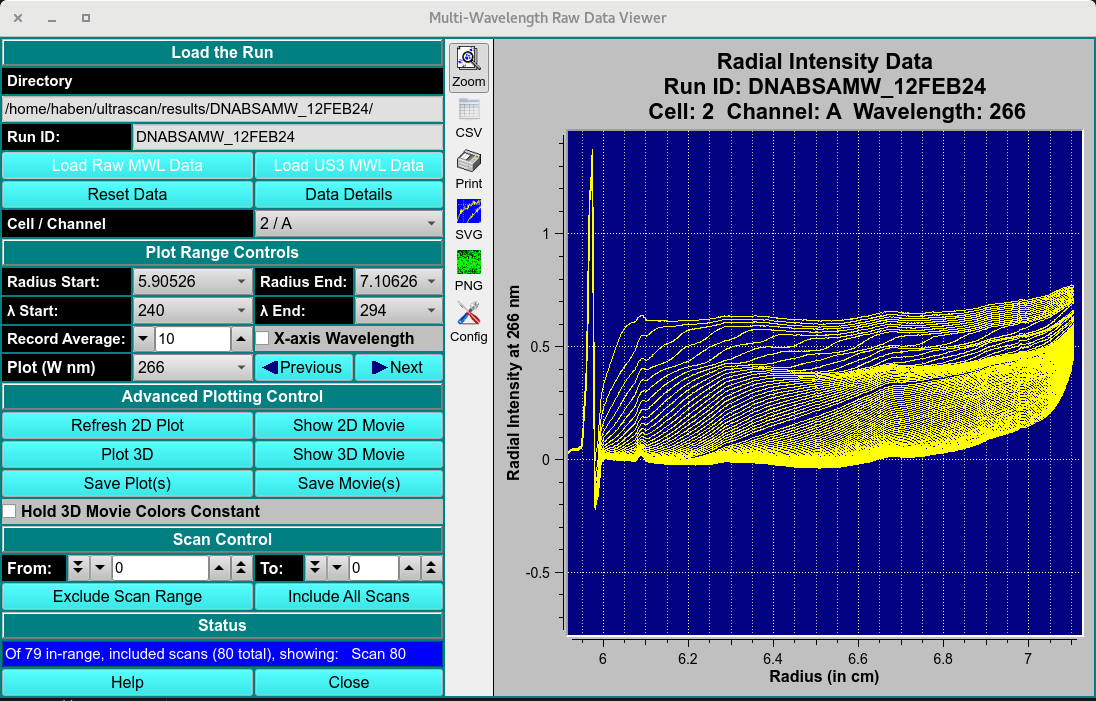
Main Window
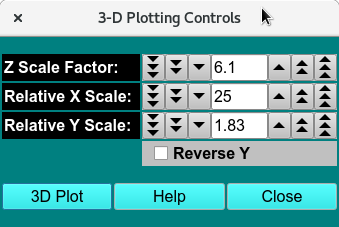
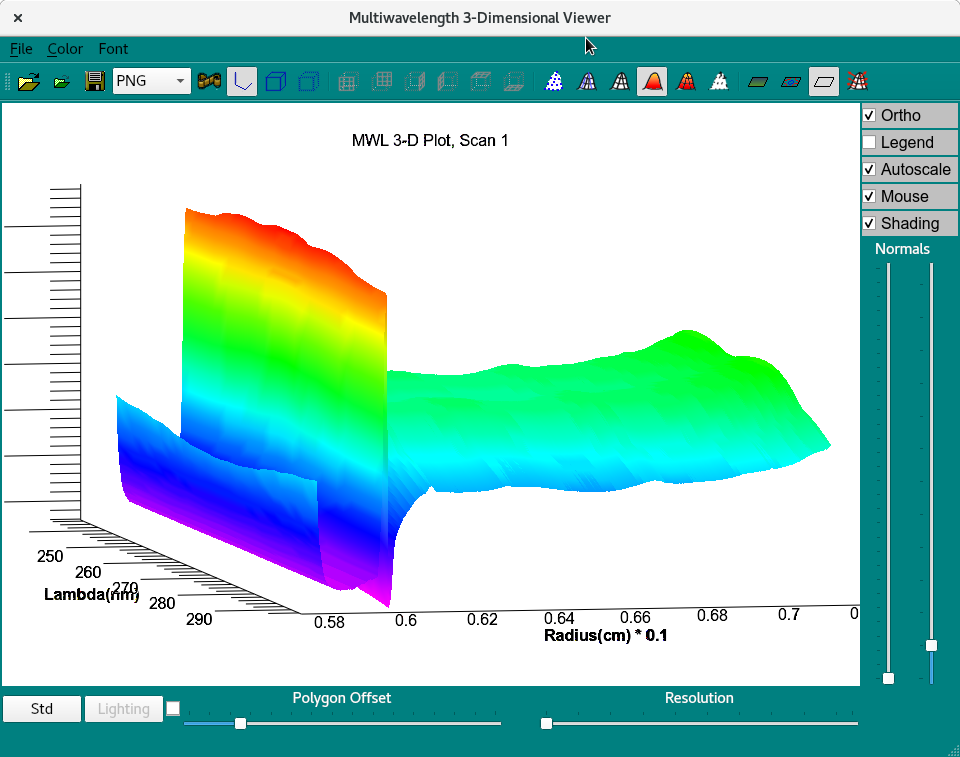
3D-Display Control and 3-D Viewer
Functions:
Directory: |
A text box to the right of this label shows the full path to currently loaded data. |
Run ID: |
A text box to the right of this label shows the currently loaded data’s run identifier |
Load Raw MWL Data: |
Click here and, in the resulting Load Data Dialog, select a run from the imports directory that contains a set of .mwrs files to load. |
Load US3 MWL Data: |
Click here and, in the resulting Load Data Dialog, select a run from the results directory that contains a set of already imported .auc files to load. |
Reset Data |
Clear data and plots in preparation for loading a new data set. |
Data Details |
Click on this button to bring up a text dialog that shows details about the currently loaded data. |
Cell / Channel |
Select the Cell/Channel of data to view. |
Radius Start: |
Select the start radius in cm. from the list of available radius values. |
Radius End: |
Select the end radius in cm. from the list of available radius values. |
λ Start: |
Select the start lambda in nm. from the list of available wavelength values. |
λ End: |
Select the end lambda in nm. from the list of available wavelength values. |
Record Average: |
Select the number of wavelength records over which to compute an average for each record. |
X-axis Wavelength |
Check this box to change the plot to one in which the X-axis is wavelength and records are radius records. |
Plot (W nm) or Plot (R cm) |
Select the identifier of the lambda or radius record to plot. |
Previous |
Click to plot the previous lambda/radius record. |
Next |
Click to plot the next lambda/radius record. |
Refresh 2D Plot |
Click this button to replot the 2-D plot after any changes in controls or ranges. |
Show 2D Movie |
Click here to begin a 2-D movie over the lambda/radius record range. |
Plot 3D |
Click to open a 3D Plot Control Dialog, from which a 3D Plot Window may be opened or replotted. Note that if a 3D Plot Window is already opened and scan ranges have been changed, this button can be clicked to re-plot the 3D Plot for the new first scan. |
Show 3D Movie |
Click here to begin a 3-D movie over the scan range. |
Save Plot(s) |
Click this button to save the current 2-D and/or 3-D plot. |
Save Movie(s) |
Click here to re-play 2-D and/or 3-D movies and save the PNG files of each frame in the reports directory. |
Hold 3D Movie Colors Constant |
Check this box before beginning a 3-D movie in order to preserve the correspondence of colors in the currently selected color map to the maximum amplitude range. By default, colors are mapped to each frame’s amplitude range. |
From: |
Select the first scan of a scan range focus. |
To: |
Select the last scan of a scan range focus. The from and to values may be used to exclude bad scan curves or to limit the range of a 3-D plot or movie. |
Exclude Scan Range |
Click on this button to exclude the currently selected range of scans. |
Include All Scans |
Click this button to revert to the full range of data scans. |
Status |
The text box below this banner shows the current status of the ongoing or just-completed process. |
Help |
Click to show this help documentation. |
Close |
Click to close the MWLR viewer |
The default 2-D plot and movie frames is of wavelength records with radius as the X axis. You may change to radius records with lambda as the X axis by checking the X-axis Wavelength box. With this checked, the main window would be similar to the following.
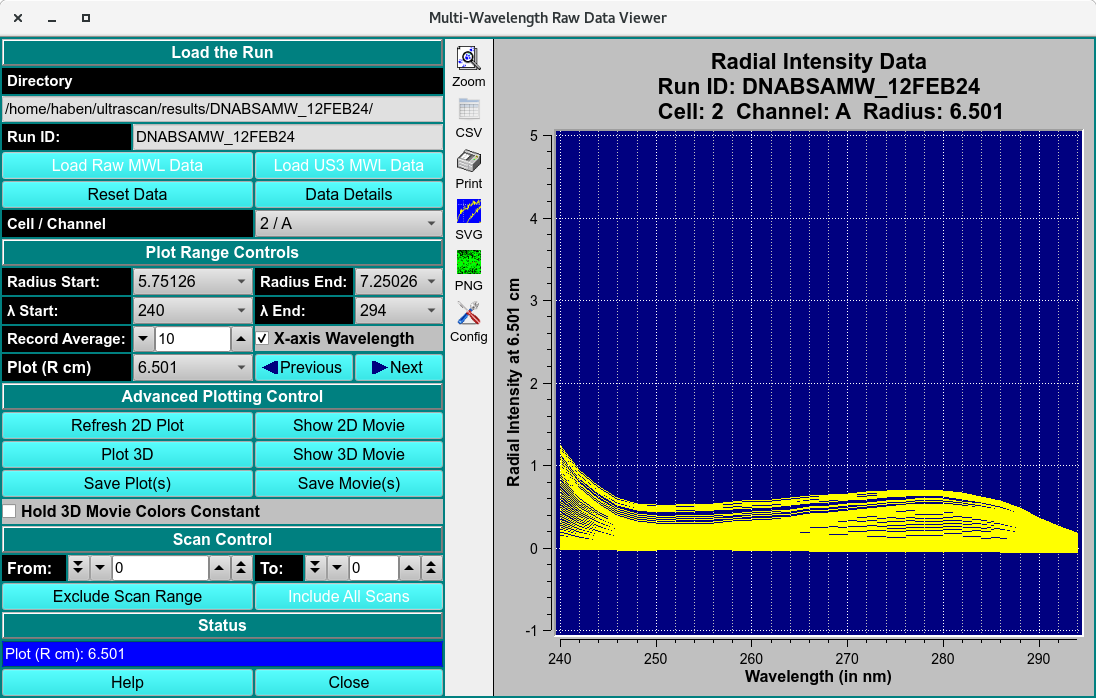
Alternate Record and X-axis