Multi-Wavelength S Spectra Viewer
This module allows the user to view the data in 3-D Plot with wavelength, and sedimentation coefficient distribution as X and Z axes.
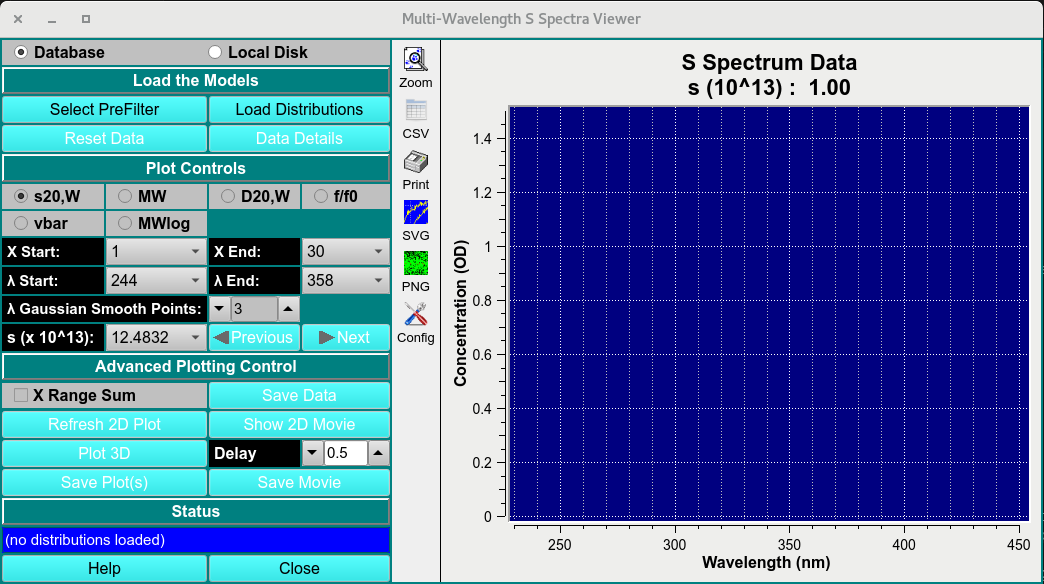
Main Window
Process:
Load MWL 2DSA-IT: Load multi-wavelength 2DSA-IT models to view by clicking on Select PreFilter then Load Distribution and select the 2DSA-IT models.
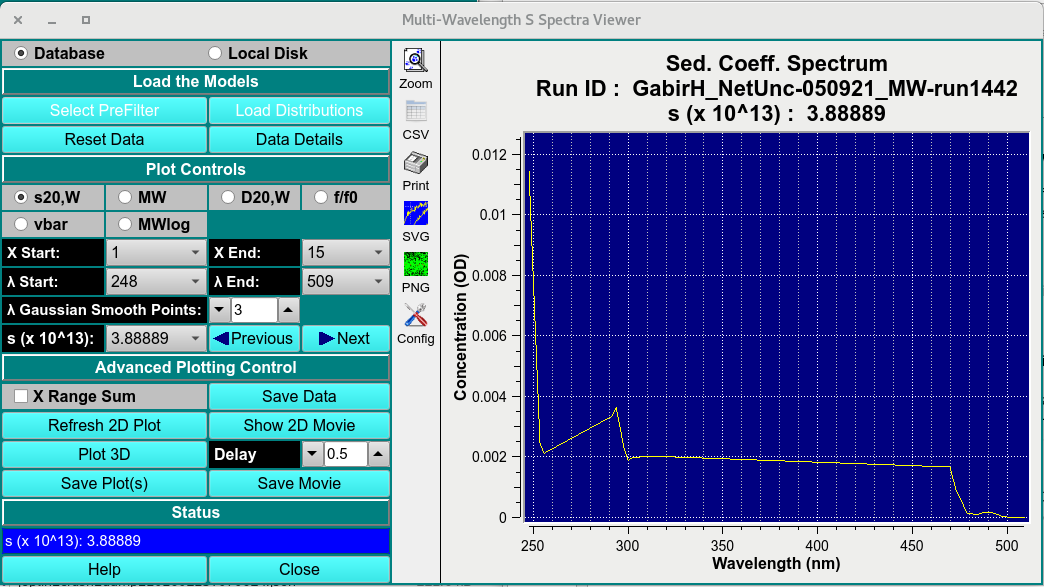
Loaded Window
Plot Controls: Set Z axis (S20,W, MW, D20,W, f/f0, vbar or MWlog) and range start (X start) and end (X End); set lambda start and end.
Advancing Plotting Control Once a 2-D plot and its ranges have been established, show a 2-D movie of all lambda/radius records to view the progression of data through record ranges.
Click on Plot 3D to bring up a control window. Within that dialog, choose scales and bring up a 3-D plot window. Continue to refine scales and orientation until the 3-D plot is as desired.
Show a 3-D Movie: Once a 3-D plot, with its scales and orientation, has been established, show a 3-D movie to see the change in data over time (scans). Note that scans may be excluded and a range of scans chosen to refine this movie.
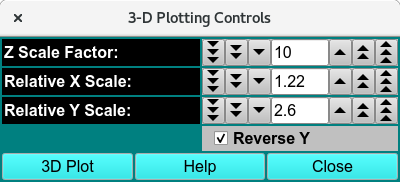
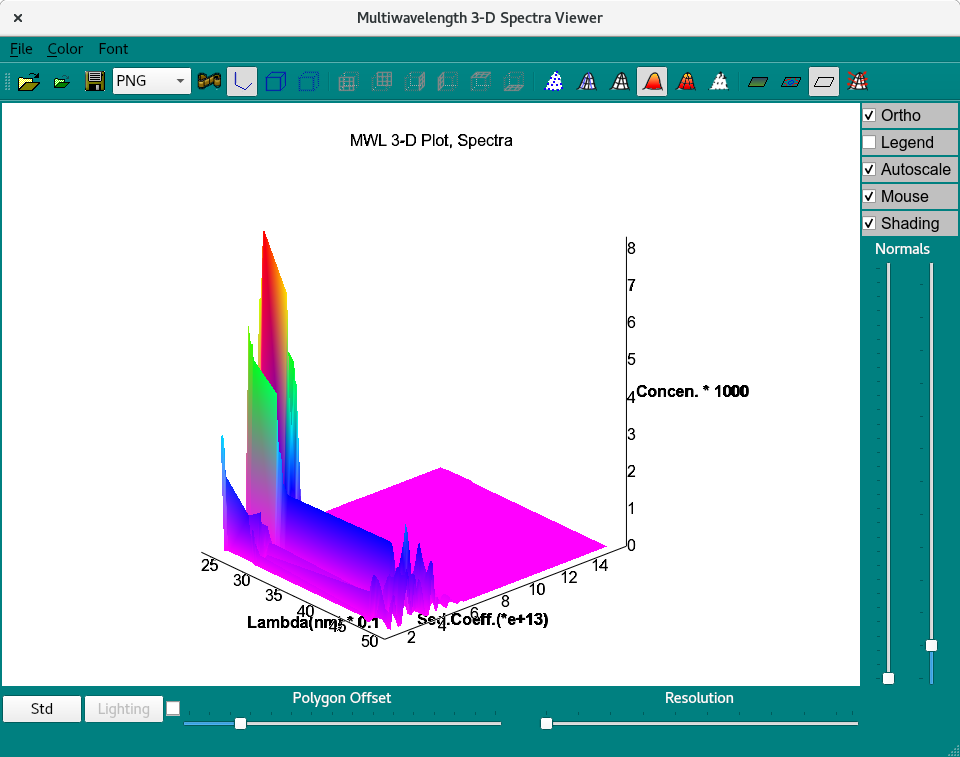
3D-Display Control and 3-D Viewer
Save Plots and Movies: When plots and movies are all in a desired and informative state, you may save the plots and save frame files from the movies for processing by external imaging software.
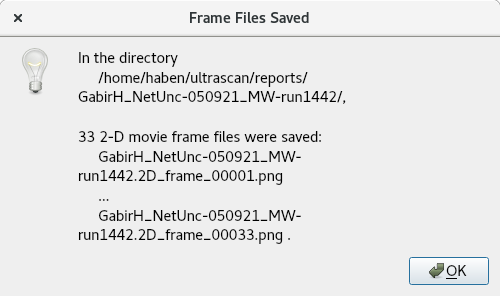
save movie as png files
Functions:
Select PreFilter |
Load a run dataset as a Prefilter using the “Select Run(s) as Models Pre-Filter (DB)”. |
Load Distribution |
Select the distributions to plot on in the “Load Distribution Model(s). |
Reset Data |
Reset loaded data. |
Data Details |
Open a detailed statistical:ref:report <stats> on selected dataset. |
Plot controls
X start and end |
Start and end range of selected Z axis attribute. |
λ start and end |
Start and end range of wavelength measured. |
λ gaussian smooth points: |
Gaussian smoothing function applied to each spectra at any given Z value. |
S (x10^13): |
View the wavelength attribute distribution for any S point (Z-axis). |
Advanced Controls:
Save data |
Save the 2-D plot data. |
Refresh 2D plot |
Refresh plot. |
Show 2D movie |
Show spectra of each S value. |
Plot 3D |
Plot the 3-D graph with X as wavelength, Z as user selected attribute, and Y as signal intensity. |
Delay |
Frame delay between frames. |
Save plots |
Save plots to $HOME/ultrascan/reports. |
Save movie |
Save movie to $HOME/ultrascan/reports. |
Status box |
Update status box. |
Help |
Help documentation to this module. |
Close |
close window. |
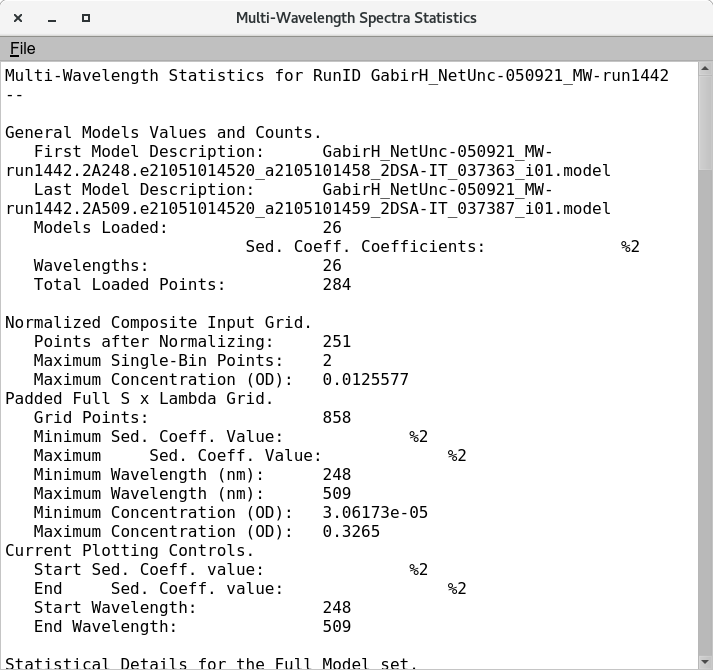
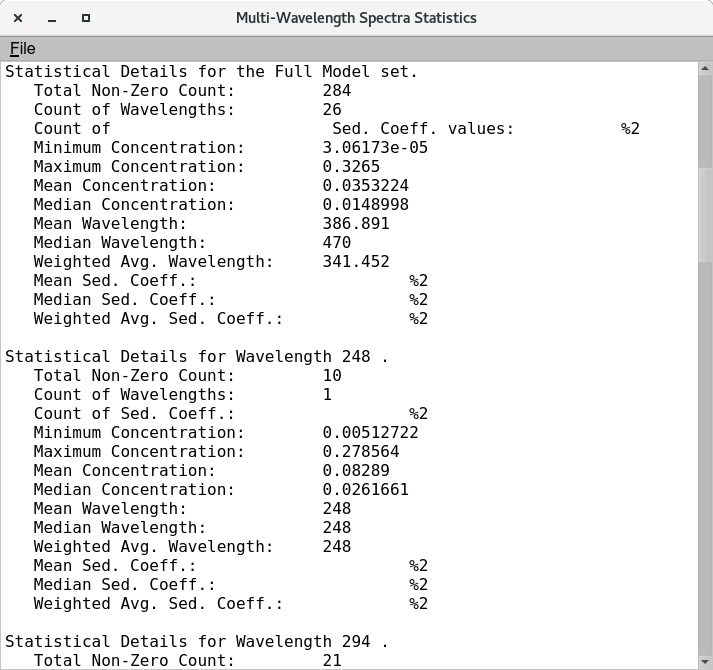
Statistical Details of loaded multi-wavelength dataset