Import Experimental Data
Import and convert raw data into the UltraScan-III OpenAUC format.
Import Experimental Data
Import and Convert Single and Multi-Wavelength Experimental Data
STEP 1: Loading Data:
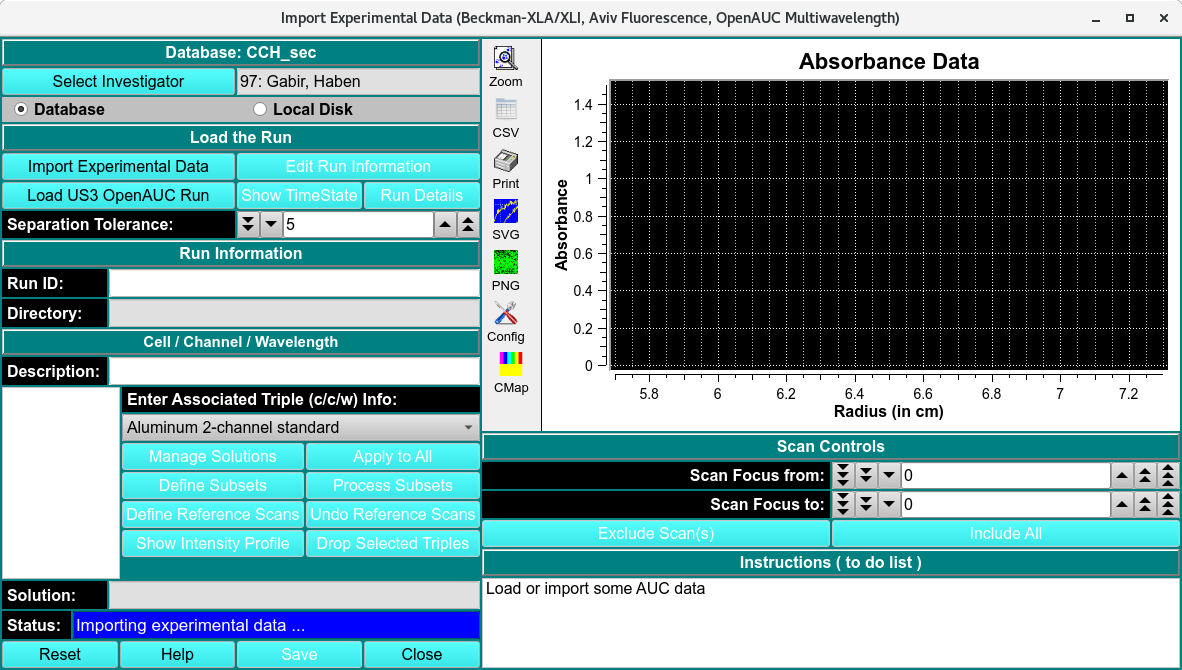
Raw data can be loaded into the window by clicking Import Experimental Data.

Single wavelength data is listed in the Cell/Channel/Wavelength (c/c/w) format.
Multi-Wavelength data:
Multi-wavelength data is listed in the Cell/Channel/Wavelength range (# of wavelengths) format. The different wavelengths in the dataset can be navigated through using the Plot λ drop-down menu and the ‘Previous’ and ‘Next’ buttons.
Data can be loaded into the window using one of the following:
Import Experimental Data: Load raw data located on the local disk
Load US3 OpenAUC Run: Load data that has already been converted to the UltraScan-III OpenAUC format using Data load dialog. This allows for steps 3 and 5 to be skipped as the information defined in these steps is populated based upon the experiment submission.

Multi-wavelength Experimental data
STEP 2: Modify Run ID (Optional):
If the run is being reimported, the Run ID must be made unique to avoid deleting the existing imported data, associated edit profiles and models.
STEP 3: Edit Run Information:

Modify Experiment Information
In the ‘Experiment Information’ window, a label can be created for the run, the ‘Select Project’ button assigns the data to a pre-existing project, the ‘Experiment Type’ drop-down menu specifies the type of experiment (Velocity, Equilibrium, Diffusion, Buoyancy, Calibration or Other), the ‘Instrument’ drop-down menu associates the data to a laboratory instrument, and the ‘Operator’ drop-down menu records the individual who conducted the experiment.
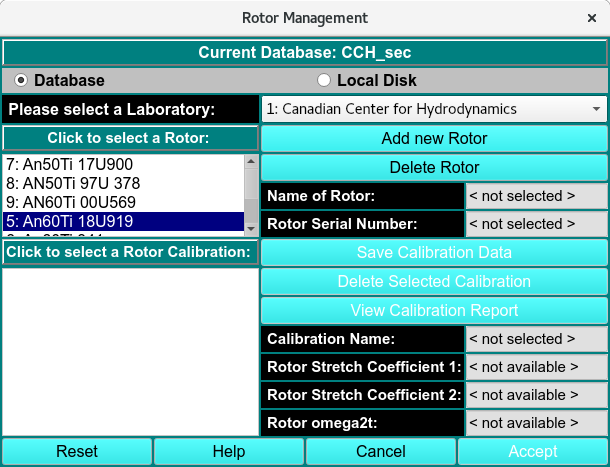
Select Lab/Rotor/Calibration: Allows for the selection of the rotor and associated rotor (stretch) calibration profile.
Edit Run Information
STEP 4: Adjust Separation Tolerance (Optional):
The separation tolerance (0-100) defines the threshold for distinguishing closely-spaced features during analysis. A larger value merges similar features to reduce noise sensitivity, while a smaller value improves resolution but increases noise sensitivity. The default value of 5 is typically sufficient for most datasets.
STEP 5: Modify Cell/Channel/Wavelength (c/c/w) Info:
The Description text box allows for notes to be assigned to each channel. Next, the centerpiece drop-down menu can be used to assign the centerpiece to each channel. The Manage Solutions button opens the ‘Solutions Management’ <solution/solution_select> window, where new or pre-existing solutions can be assigned to each channel. Apply to All assigns the centerpiece and solution information of the currently channel to all channels.
Dropping Data: ‘Drop Selected Data’ removes all of the wavelengths for a particular cell and channel. ‘Drop All Channel ‘A’s removes all of the listed A channels when an ‘A’ channel is selected in the list. ‘Drop All Channel ‘B’s removes all of the listed B channels when a ‘B’ channel is selected in the list. ‘Drop Selected Triples’ opens the ‘Triples Selector for Deletes’ window:
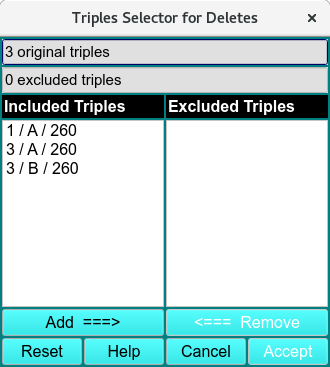
Triples Selector for Deletes
Triples are highlighted on the Included Triples list and added to the Excluded Triples list using the Add ===> button. Triples can be removed from the Excluded Triples list using the <=== Remove button, and both lists can be set back to default using the Reset button. The excluded Triples selection can be confirmed using the Accept button.
STEP 6: Saving the data:
Finally, the data can be saved to the database or disk using the Save button. If the Save button is unavailable, some of the tasks in the Instructions (to do list) have not been completed. Completing these tasks will activate the button to allow for saving.
Processing different data types and datasets
Radial intensity (RI) data
6- and 8- channel centerpieces
Wavelength data
Radial intensity (RI) data:
The Define Reference Scans button displays the last scan for the first wavelength of all channels:
CTRL-clicking the centre of the air-gap region above the meniscus defines the reference scans and converts the intensity data for all channels to pseudo-absorbance data:

Last Scans of all Channel defined as Reference scans

Pseudo-Absorbance data with Defined Reference Scans
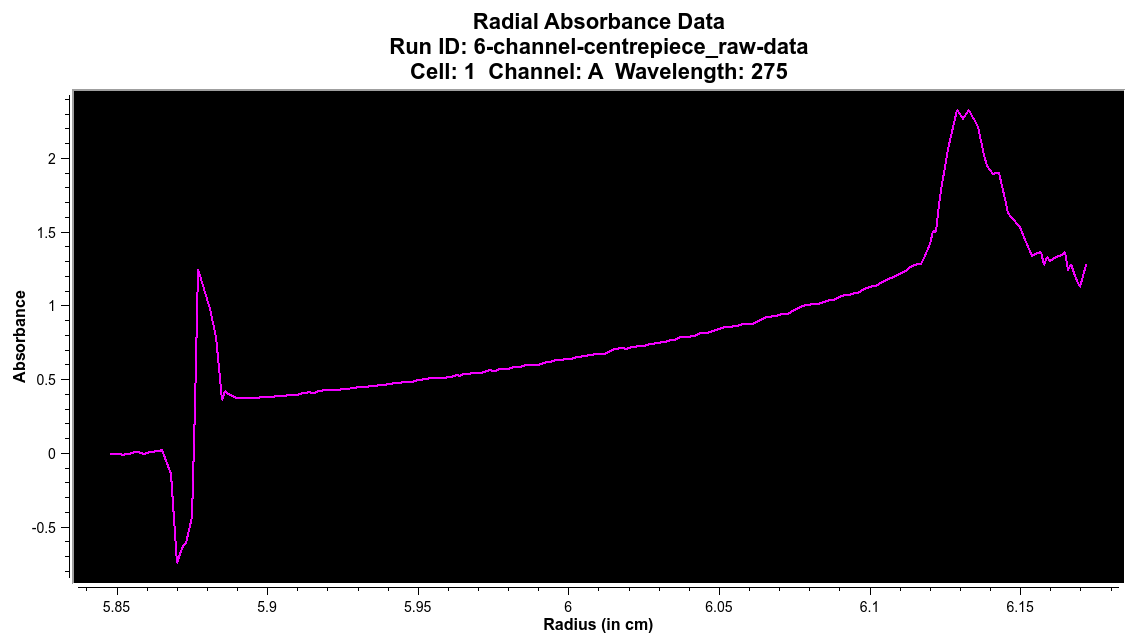
6- and 8- channel centerpieces:
When a 6- or 8- channel centerpiece is used, there will be multiple channels in a single measured channel that need to be separated into individual c/c/w Triples. The ‘Define Subsets’ button allows for these c/c/w Triples to be defined by CTRL-clicking at the radius that separates the channels. The starting and ending radius for the entire dataset does not be specified as these values are assumed.
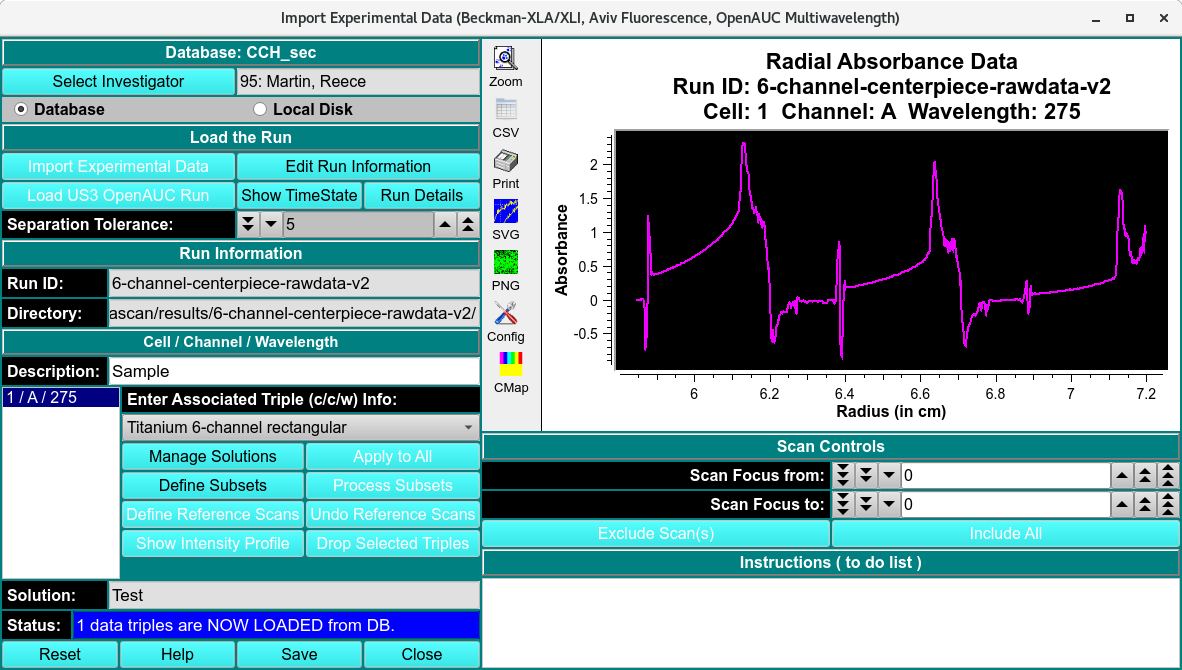
Raw and Unprocessed 6- Channel Dataset
The Process Subsets button separates the c/c/w Triples.
Single Separated Channel from 6- Channel Dataset
Wavelength Data:
Wavelength scan data is listed in the Cell/Channel/radial position (c/c/r) format.
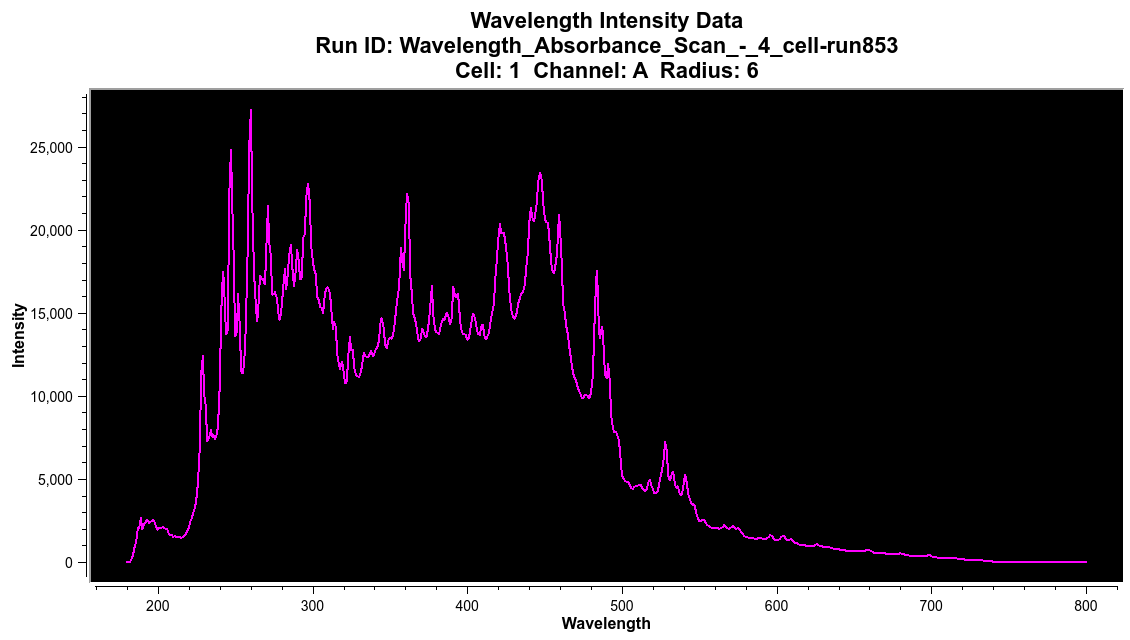
Wavelength Dataset