Density Matching
Density Matching (DM) experiments are used to determine the partial specific volume of colloidal particles by repeating the velocity experiment in a range of buffers with a different density, but identical chemical properties. Here it is important that the ionic strength and pH stay constant. This is most easily accomplished by using D2O (heavy water) which has mostly the same chemical properties as light water. The change in buoyancy incurred when changing the density of the solvent causes a change in sedimentation speed, which can be measured. The change is proportional to the density of the analyte. Density matching experiments exploit this difference.
It is recommended that users of this technique measure sedimentation velocity experiments in 4-6 different D2O concentrations, including one buffer that does not have any D2O in it (just light water). Finite element models from these experiments Function are imported into this program to elucidate the partial specific volume distribution for the entire solution mixture.
Density Matching Window
DM Functions:
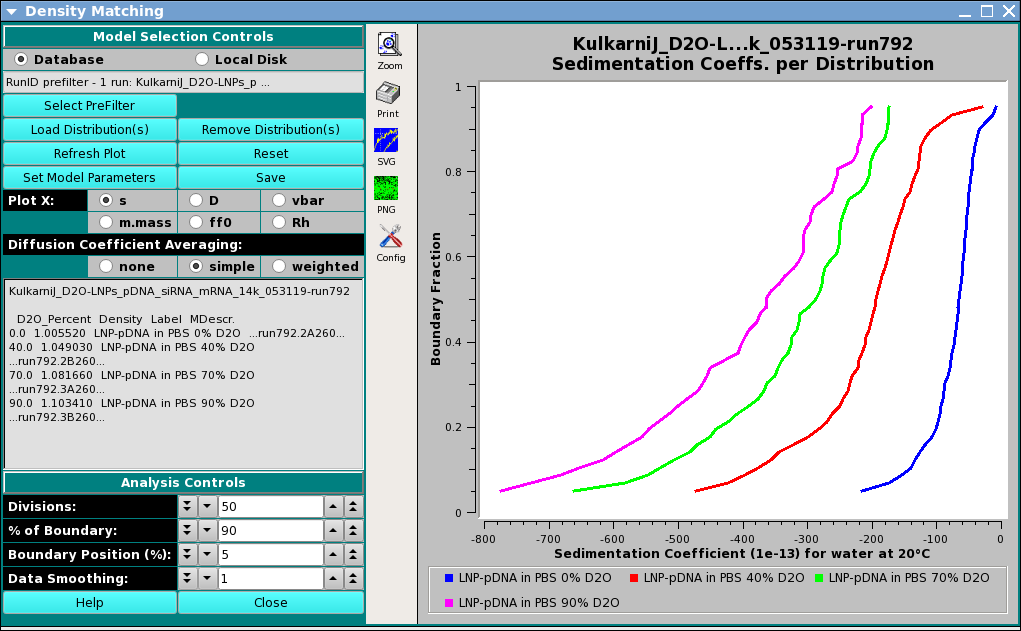
Model Selection Controls
Database |
Check this radio button to indicate that distribution data to be selected is in the database. |
Local Disk |
Check this radio button to indicate that distribution data to be selected is on local disk file systems. |
(prefilter text): |
Brief information about PreFilter selection(s) made. |
Select PreFilter: |
Open a Models Pre-Filter dialog to select Run IDs on which to pre-filter lists of models for loading. |
Load Distribution(s): |
Load model distribution data to use in density matching, as specified through a Model Loader dialog. |
Remove Distribution(s): |
Open a Remove Models dialog to pare down the list of selected models. |
Refresh Plot: |
Force a re-plot of the currently selected plot type. |
Set Model Parameters: |
Open a Model Parameters dialog to associate D20_Percent, Density, Label values with each model. |
Save: |
Generate CSV spreadsheet files and PNG plot files for all plot types and save them locally to a runID subdirectory of the /ultrascan/reports directory. |
Plot X: |
Select the plot to currently be displayed by selecting its X axis: |
|
|
Diffusion Coefficient Averaging: |
Select the means of averaging diffusion coefficients at each boundary fraction, across models: |
|
|
(Distribution Information text box) |
Information about Run and Model Distributions currently being used. |
Divisions:) |
Set the number of boundary fraction divisions to use. |
% of Boundary::) |
Set the extent in boundary percent over which plot values are computed and plotted. |
Boundary Position (%)::) |
Set the starting boundary percent. |
Data Smoothing::) |
Set the number of smoothing points to use in curves displayed. |
Window Controls
Reset Plot |
Clear PreFilter and Distribution selection data. |
Help |
Display this detailed Density Matching help. |
Close |
Close all windows and exit. |
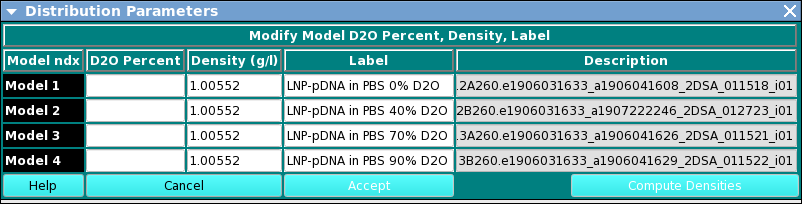
Density Matching Model Parameters:
An option in UltraScan-III US_Density_Match, this dialog allows specifying parameters associated with each model distribution. The dialog presents a row for each model selected in the calling Density Matching main window. In each model row, the user may add or change the value for (1) D2O (heavy water) percent; (2) density; or (3) model label. After setting all percent values, the Compute Densities button causes computation of the densities for non-zero-percent models, based on the zero-percent model density value. Once all model values are set, the Accept button closes the dialog and returns the values associated with each model.
Upon entry, the dialog appears as follows.
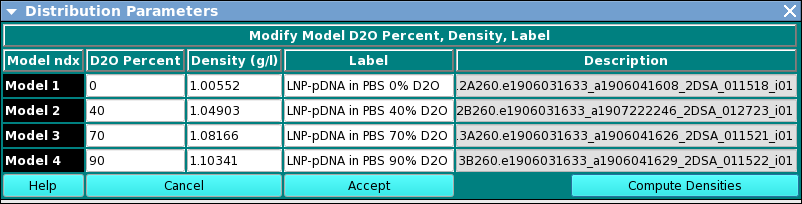
After completion of parameter setting, the dialog will appear similar to this:
DM. Model Para. Functions
(D2O Percent column): |
Text boxes allow setting D2O percent values for each model. |
(Density (g/l) column) |
Text boxes allow setting density values in grams per liter for each model. Initial values are computed and often need not be manually changed by the user. |
(Label column): |
Text boxes allow setting labels for each model that are used in the Legend of each plot. |
(Description column): |
Read-only text boxes display the description text associated with each model. |
Help: |
Display this documentation. |
Cancel: |
Exit this dialog without returning parameter values to the caller. |
Accept: |
Exit this dialog and return parameter values to the caller. |
Compute Densities: |
Compute densities values for all models with non-zero D2O percent values . |