2-Dimensional Spectrum Analysis
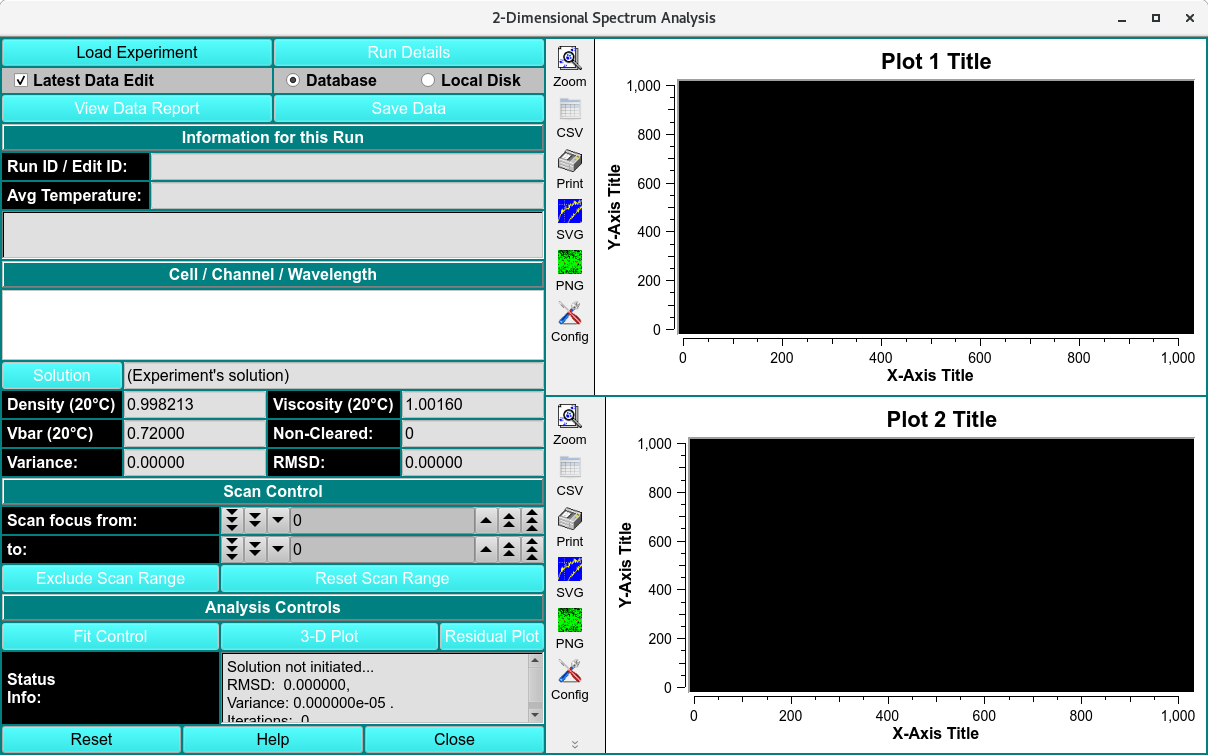
This module enables you to perform 2-dimensional spectrum analysis on a chosen experimental data set. This module fits varying pairs of s and f/f0 with constant Vbar or varying pairs of s and Vbar with constant f/f0 Upon completion of an analysis fit, plots available include: experiment; simulation; overlaid experiment and simulation; residuals; time-invariant noise; radially-invariant noise; 3-d model. Final outputs may include one or more models and noises.
Table of Content:
2DSA Overall Process
Step 1: First, load experimental velocity data. Click on Load Data to select an edited velocity data set from the database or from local disk.
Step 2: Secondly, open an analysis control window by clicking on Fit Control. Within that dialog, define the grids and iterations that comprise the analysis.
Step 3: Next, after having specified analysis parameters, begin the fit analysis by clicking “Start Fit”.
Step 4: Display and Save Results: After simulation, a variety of options are available for displaying simulation results, residuals, and distributions. Report text files and graphics plot files can also be generated.
2-Dimensional Spectrum Analysis